Improving Lab Performance with Six Sigma
Do you want to reduce lead times while improving productivity in your QC testing laboratory? Read the following case study to find out how.
This case study shows how a lean six sigma project at a leading global pharmaceutical company managed to reduce lead times while improving productivity in their QC testing laboratory using the DMAIC approach.
Lean and six sigma have been popular methodologies in manufacturing for years and are now beginning to migrate outside of their traditional manufacturing habitat. However there are challenges in implementing these methodologies in other areas. Laboratories are a taxing environment in which to implement lean and six sigma but creative adaptation of the techniques can deliver significant improvements in cost or speed.
Define Lean Lab Goals
Defining the goals of any lean laboratory project seems like a simple task, but it is critical to whether the project will be viewed as worthwhile by the wider company and top management. The goals of the project should be chosen to mirror those of the business. In this case the goals of the site were to reduce “End to End” cycle time of their products while keeping the cost per unit as low as possible. The goals of the lab project were picked to mirror these, i.e. to reduce the cycle time for testing and release of product and to do so as productively as possible.
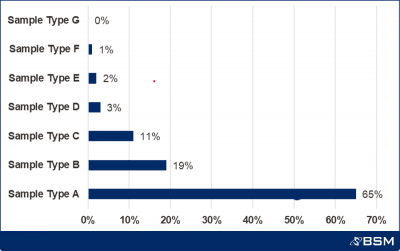
Tools such as Pareto plots and value stream maps are useful in deciding where the focus of a lean laboratory project is to be. A Pareto analysis of the incoming laboratory workload revealed that the majority of the workload (85-95%) is driven by 2-3 products. In situations like this, the most benefit can be obtained by focusing on these products.
Product A and C were from the same product family, received the same tests and could be tested together at the same time. While Product B accounted for 19% of the sample volume it did not account for 19% of the labs workload as it only required two very simple tests, while A and C received nine different tests. The project team decided to focus exclusively on A and C as it accounted for 80-90% of the labs workload and was the main priority of the site.
The “As is” Process Map revealed a significant portion of the cycle time is due to the approval and release activities carried out after the batches were fully tested. As a result it was decided that approval activities would also be within the scope of the project.
Measure Lean Lab Performance
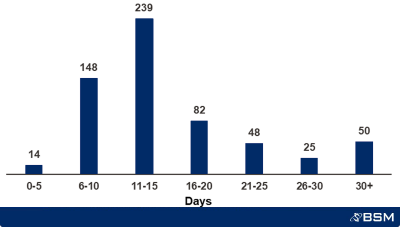
The Measure phase of the project was to establish valid reliable metrics to monitor progress towards the chosen goals. The lab already had in place metrics on cycle time. A look at the breakdown of cycle times for Product A showed a spread of times centred around 11-15 days which corresponded to the labs target cycle time of 15 days. 66% of samples met the 15 day target time while 33% of samples were late. The average cycle time was 14.8 days.
Looking at resourcing in the lab, it was immediately striking that the vast bulk of the resources were occupied by one test; test x. The results of this test were required by a separate department to proceed with their process. As a result the laboratory heavily resourced this test with the aim of trying to test every sample every day. This was inefficient as it resulted in variable numbers of samples tested each day. For example, on one day, five analysts might test 12 samples and the following day they may only test 4, a 67% drop in productivity from one day to the next. A strategy was required that would be consistently productive without adversely affecting cycle times. To do this it would be necessary to control the number of samples tested each day.
Analyze Data
The Analyze phase of the project looked at all the available data to determine the best way to move towards the desired goals of the project. It was found that:
- Daily the lab received between 1 and 17 samples resulting in an average of 7 per day.
- Weekly the lab received between 25 to 45 samples resulting in an average of 36 per week.
- The weekly incoming workload was much less volatile than the daily pattern (coefficient of variance 0.2 versus 0.6).
- A fixed, weekly repeating pattern of tests (a Rhythm Wheel).
- Testing at the weekly average every week i.e. testing at the weekly takt rate.
- Every test would be run every week.
- Samples would be tested in FIFO (first in first out) order.
Improve Lab Productivity
- The optimum number of samples for one analyst to test in one shift.
- The best order in which to perform test activities.
- Any improvements that could be made to the process.
- Long periods of inactive time that could be used to run other short tests.
- How many times to run the test each week.
- It was vastly more productive than the old system, requiring only 40 FTE shifts versus 54, (a 26% improvement).
- It removed the uncertainty around the equipment capacity and avoided equipment conflicts.
- It removed a lot of the stress and scrambling from the daily testing routine for the analysts.
- Every test is run every week to ensure consistent and short lead times.
Control Phase
- The activities required for the test role.
- The best order in which to complete them.
- Clear break targets.
The roles were very successful at sustaining the productive roles within the laboratory.
The KPI’s (key performance indicators) were printed and posted weekly to show exactly how the labs cycle time performance was. There was a definite moral boost to the lab to see the lab performance consistently ahead of their targets. Before the six sigma lean lab project 66% of samples were tested inside the 15 day target time. After the project was completed the target was changed to 10 days, and all samples were consistently tested within the target time, with an average lead time of 8 days. There was an annualised 3.9 fold return on investment for the project (ROI).
Our consultants can provide further information on the above and discuss any aspect of Real Lean Transformation, simply set-up a call today.


